Pages 113–120 · Markdown
Chapter 16 – Graphics
In this chapter, we shall see how to draw pictures on your ZX Spectrum Next's screen. As we learned in Chapters 14 and 15, Layer 0 can only use 175 pixels out of its maximum 192 pixel vertical resolution while the other layers accept the maximum height defined by the layer as their vertical resolution. Moreover, if you recall Fig. 9 and 10, Layer 0 has a different graphics coordinate origin from the rest of the layers/modes located at the bottom leftmost of the screen instead of the top leftmost. All basic graphics commands that we will explore (PLOT, DRAW, CIRCLE and POINT) accept both coordinate origins while the LAYER and TILE commands (as well as the SPRITE command we'll explore in the following chapter) accept only the top leftmost corner as the coordinate origin. The side-effect of these inverted coordinate systems is that most graphics you will program will appear inverted on the y-axis if you do not account for that difference. We'll illustrate this fact shortly.
PLOT
The statement:
PLOT x_coordinate, y_coordinate
inks in the pixel with these coordinates, so this measly program:
10 PLOT INT(RND*128), INT
   (RND*96):INPUT a$: GO TO 10
plots a random point each time you press ENTER. This will work on all layers1, although it will not use the entire area of the screen in all modes. Can you figure out why?
Here is a rather more interesting program. It plots a graph of the function SIN (a sine wave) for values between 0 and 2π:
10 FOR n=0 TO 255: REM change
   to 127 for LoRes
20 PLOT n,88+80*SIN(n/128*PI)
30 NEXT n
This next program plots a graph of SQR (part of a parabola) between 0 and 4:
10 FOR n=0 TO 255
20 PLOT n,80*SQR (n/64)
30 NEXT n
Notice that when in Layer 0, pixel coordinates are rather different from the line and column in an AT item. You may find the diagrams in Chapter 14 useful when working out pixel coordinates and line and column numbers for Layer 0. The other layers as we've already discussed are pretty straightforward. To illustrate, switch to HiRes and try again. What you see when entering:
 5 LAYER 1,2
10 FOR n=0 TO 255
20 PLOT n,80*SQR (n/64)
30 NEXT n
and run the program is exactly what we were talking about earlier. Our graph, has changed both orientation and stops at the middle of the screen's width. To make the out-
1 All layers, EXCEPT Layer 3 and the High Res versions of Layer 2 as they're not directly supported by NextBASIC.
put similar to the the first iteration of the program you will need to change the FOR loop and PLOT commands to:
10 FOR n= 0 TO 511
20 PLOT n,80*SQR((511-n)/128)
This will invert the coordinates to simulate the Layer 0 display, by drawing inverted, extend the PLOT x coordinate to 512 pixels and make sure the PLOT doesn't get out of bounds (that's why we divide by 128 instead of 64). In reality, you do not need to check if you PLOT out of bounds for layers other than Layer 0, as graphics commands for these accept locations outside the screen's pixel boundaries, however it's good practice to do so if you want your program to work across layers.
DRAW and CIRCLE
To help you with your pictures, the computer will draw straight lines, circles and parts of circles for you, using the DRAW and CIRCLE statements.
The statement DRAW to draw a straight line takes the form:
DRAW x_coordinate, y_coordinate
The starting place of the line is the pixel where the last PLOT, DRAW or CIRCLE statement left off (this is called the PLOT position; RUN, CLEAR, CLS and NEW reset it to the coordinate 0 of the selected Layer (bottom left hand corner, at (0,0) for Layer 0, top left hand corner for all other layers), and the finishing place is x pixels to the RIGHT of that and y pixels UP or DOWN depending on which layer you're on. This would be UP for Layer 0 and DOWN for all other layers. The DRAW statement on its own determines the length and direction of the line, but not its starting point.
Experiment with a few PLOT and DRAW commands, for instance:
PLOT 0,100: DRAW 80,-35
PLOT 90,150: DRAW 80,-35
Notice that the numbers in a DRAW statement can be negative, although those in a PLOT statement can't. Remember always, that the display direction of the DRAW statement changes according to the coordinate system used, ergo which layer you choose is very important. You can also plot and draw in colour, although you have to bear in mind all that were discussed in Chapter 15. Depending on the chosen layer, colours may cover the whole of an attribute position instead of individual pixels. Only LoRes and Layer 2 modes offer full individual colour pixel control whereas other layers rely on the attribute used. The following program demonstrates this:
  10  LAYER 2,0: REM disable Layer
       2
  20  FOR m=0 TO 5
  30  PROC LayChange (m)
  40  BORDER 0:PAPER 0:INK 7:CLS:
       REM black out screen
  50  x1,y1=0:REM line start
  60  c=1: REM ink, starts with
       blue
  70  FOR r = 0 TO 9:REM 10
       repetitions
  80  x2=INT (RND*256): y2=INT (RND*128):
      REM random line end
  90  DRAW INK c;x2-x1,y2-y1
 100  x1,y1=x2,y2: REM next line starts
      where last one finished
 110  c+=1:IF c=8 THEN c=1
 120  NEXT r
 130  PAUSE 0: REM Display inspection
 140  NEXT m
 150  STOP
1000  DEFPROC LayChange (mode)
1010  IF mode=0 THEN LAYER 0
1020  IF mode=1 THEN LAYER 1,0
1030  IF mode=2 THEN LAYER 1,1
1040  IF mode=3 THEN LAYER 1,2
1050  IF mode=4 THEN LAYER 1,3
1060  IF mode=5 THEN LAYER 2,1
1070  ENDPROC
In layers other than LoRes and Layer 2, you can see how the lines seem to get broader as the program goes on, and this is because a line changes the colours of all the inked-in pixels of all the attribute positions that it passes through. You may also be temporarily perplexed about how the program doesn't crash on LoRes given that the selected values can exceed these of the physical resolution (see line 80). This would definitely be true for compatibility reasons on Layer 0, however on other layers, graphics output off screen is permitted for x and y values up to 65535. Note that you can embed PAPER, INK, FLASH (only on layers that this is available or not turned off by enabling the EnhancedULA functionality), BRIGHT (idem), INVERSE and OVER items in a PLOT or DRAW statement just as you could with PRINT and INPUT. They go between the keyword and the coordinates, and are terminated by either semicolons or commas.
An extra frill with DRAW is that you can use it to draw parts of circles instead of straight lines, by using an extra number to specify an angle to be turned through; the form is:
DRAW x_coordinate, y_coordinate, arc_turn
x_coordinate and y_coordinate are used to specify the finishing point of the line just as before and arc_turn is the number of radians that it must turn through as it goes; if arc_turn is a positive it turns to the left, while if arc_turn is a negative it turns to the right. Another way of seeing arc_turn is as showing the fraction of a complete circle that will be drawn: a complete circle is 2π radians, so if a=π it will draw a semicircle, if a=**0.5***π a quarter of a circle, and so on.
For instance suppose a=π . Then whatever values x and y take, a semicircle will be drawn. Run:
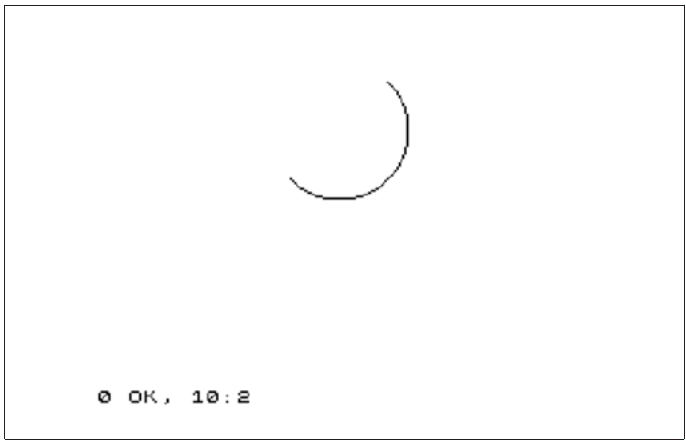
10 PLOT 100,100: DRAW 50,50, PI
which will draw this:
0 OK, 10:2
Fig. 14 – Arc drawn with DRAW statement
When run on Layer 0, the drawing starts off in a south-easterly direction, but by the time it stops it is going north-west: in between it has turned round through 180 degrees, or π radians (the value of a). Obviously, when run on other layers, the vertical part of the drawing is inverted in line with everything we have discussed.
Run the program several times, with PI replaced by various other expressions e.g. -PI, PI/2, 3*PI/2, PI/4, 1,0.
Notes
Due to the way values are calculated, it's not advisable to use values exceeding π for the arc_turn parameter as they may not perform in the way you would intend. That being said there are various values that produce very interesting results. Try:
PLOT 75,75: DRAW 80, 24, xwhere x is 400, 600 or 800. Experiment further to see what other effects you can generate.
The last statement in this section is the CIRCLE statement, which draws an entire circle. You specify the coordinates of the centre and the radius of the circle using:
CIRCLE x_coordinate, y_coordinate, radius
Just as with PLOT and DRAW, you can put the various sorts of colour items in at the beginning of a CIRCLE statement. As with its PLOT and DRAW counterparts, CIRCLE, when used in Layer 0 will produce an error for circles drawn out of bounds but the remaining layers will happily draw off-screen.
POINT, POINT TO
The POINT function informs you of the contents of a pixel on screen. It accepts two parameters enclosed in parentheses, x_coordinate and y_coordinate. POINT on its own works only on Layer 0 and returns 1 if the pixel is set or 0 if not set. Whilst in Layer 0 try:
CLS: PRINT POINT (0,0): PLOT 0,0
:PRINT POINT (0,0)
There's an extended variant of POINT utilising the TO modifier which works on all layers, that takes the output of POINT and stores it in variable var. This returns 1 if the pixel is set or 0 if not set in all layers except LoRes and Layer2 just as the plain POINT does. In LoRes and Layer 2 however, it returns a value from 0 to 255 which is the actual palette index entry
that the pixel with these coordinates is set to. To illustrate this rewrite the previous example as:
CLS: POINT 0,0 TO t: PRINT t: PLOT
0,0:POINT 0,0 TO t: PRINT t
Although this may not be the best example for the benefits of using POINT TO instead of the simple POINT, you can save a lot of typing by foregoing a lot of LET statements whilst, at the same time, making your code a lot easier to read and working in every graphics mode. It's important to mention that POINT TO does not return the contents of a sprite that's currently on the given coordinates on screen and instead will return the contents of the layer it's run on.
Notes
POINT here is a function and not a PRINT modifier. Note the distinction as it's important.
Using OVER and INVERSE with graphics commands
Enter screen mode (EDIT for NextBASIC Menu and then the Screen option) in the editor and then type:
PAPER 7: INK 0
and let us investigate how INVERSE and OVER work inside a standard graphics statement. These two affect just the relevant pixel, and not the rest of the character positions. They are normally off (0) in a graphics statement, so you only need to mention them to turn them on (1).
Here is a list of the possibilities for reference:
- PLOT: This is the usual form. It plots an ink dot, i.e. sets the pixel to show the ink colour.
- PLOT INVERSE 1: This plots a dot of ink eradicator, i.e. it sets the pixel to show the paper colour.
- PLOT OVER 1: This changes the pixel over from whatever it was before: so if it was ink colour it becomes paper colour, and vice versa.
- PLOT INVERSE 1; OVER 1: This leaves the pixel exactly as it was before; but note that it also changes the PLOT position, so you might use it simply to do that.
As another example of using the OVER statement fill the screen up with writing using black on white, and then type:
PLOT 0,0: DRAW OVER 1;255,175
This will draw a fairly decent line, even though it has gaps in it wherever it hits some writing. Now do exactly the same command again. The line will vanish without leaving any traces whatsoever. This is the great advantage of OVER 1. If you had drawn the line using:
PLOT 0,0: DRAW 255,175
and erased it using:
PLOT 0,0: DRAW INVERSE 1;255,175
then you would also have erased some of the writing. Now try:
PLOT 0,0: DRAW OVER 1;250,175
and try to undraw it by:
DRAW OVER 1;-250,-175
This doesn't quite work, because the pixels the line uses on the way back are not quite the same as the ones that it used on the way down. You must undraw a line in exactly the same direction as you drew it.
Note, that being in screen mode in the editor is required for the examples above, otherwise the screen will be reset after each command and you will not get to see the results of the OVER and INVERSE modifiers.
Using stippling patterns to generate additional colours
One way to get unusual colours is to mix two normal ones together in a single square, using a user-defined graphic. These patterns are called stipples and work reasonably well in lower layers other than LoRes (where the pixels are too big) and exceptionally well in Layer 2 where both the available colours and resolution combine to make the results quite believable. Run this program:
1000 FOR n=0 TO 6 STEP 2
1010 POKE USR "a"+n, BIN
     01010101: POKE USR
     "a"+n+1, BIN 10101010
1020 NEXT n
which gives the user-defined graphic corresponding to a chessboard pattern. If you print this character (Graphics mode, then A) in red ink on yellow paper, you will find it gives a reasonably acceptable orange. You can obviously simulate the same behaviour with PLOT statements. This is slower than UDGs but it's much more flexible in the diversity of patterns that you can create.
Quick erase and fill using LAYER ERASE
NextBASIC lacks a dedicated fill command, however large rectangular areas on screen can be filled (or emptied) in LoRes and Layer 2 using the compound LAYER ERASE statement with 4 coordinate parameters (+ 1 optional fill parameter). The command:
LAYER ERASE x1,y1,x2,y2,c
will fill the rectangular area delineated by (x1,y1) and (x2,y2) with the global transparency colour (if the optional c parameter is not specified) or with the colour index contained in the c parameter taken from the active palette for the selected layer.
Clipping windows
One of the nicer features that come as a result of the layer system is the ability to superimpose/combine graphics that exist in separate memory spaces. This is possible on the one hand due to the existence of the transparency colour and on the other hand due to the ability to order the layer superimposition order. The latter is controllable via the LAYER OVER compound command as we saw in the More on the LAYER command section in Chapter 14.
This can be further enhanced with the creation of clipping windows which are basically smaller areas of a certain layer where all display in this layer goes and leaves the layers underneath visible (without having to set the entire area to be visible to a transparent colour). If you wish to visualise this, imagine a glass window with a rectangular section painted so you cannot see what's behind. That rectangular section is the clipping window, in essence the opposite of a regular window. The compound command:
LAYER DIM x1,y1,x2,y2
sets the clip window for the current layer from (x1,y1) to (x2,y2). Areas of the layer outside this window are not visible. Note that all Layer 1 modes and Layer 0 share the same clip window; Layer 2, Layer 3 and the Sprite System have their own separate clip windows. Refer to Chapter 22 for more information on how clipping windows are defined using the Next Registers. The compound command:
LAYER CLEAR
will reset all layer information to defaults. This is also done by NEW. It resets banks, mode, Layer 2 enable status, layer offsets / clipping windows and layer ordering.
Tiling
Since straight graphics commands can be slow, NextBASIC provides a set of commands that can help recreate parts of, or entire Layer 2 and LoRes screens, very quickly; something that can be very useful especially when a lot of screen elements are being repeated. These screen elements are called tiles and much like their real-word counterparts, they are a self-contained graphical rectangular pattern. Tiles can be repeated as many times as we need them to, or be completely independent.
Each tile can be 8x8 pixels or 16x16 pixels in size. This allows a 16K bank to hold 256 8x8 tiles or 64 16x16 tiles. Tiles are numbered 0...255. Therefore, a complete set of 8x8 tiles occupies a single 16K bank, and a complete set of 16x16 tiles occupies four 16K banks. If you use 16x16 tiles, you can restrict the tile number used and therefore reduce the memory requirements (e.g. if you need 64 or fewer different tiles, only 1 16K bank is required). Additionally for tiles to be recalled, a special linear map, called a tilemap2, of 8-bit tile numbers is needed. The user can specify any width up to 2048 tiles; each row of tiles follows directly after the previous one.
The tilemap must be fully contained inside a single 16K bank. This gives a maximum tilemap size of 256x64, 128x128, 2048x8 etc.
Any pixels in a tile which are the same colour as the current global transparency colour will not be written to the screen. If you want to draw pixels containing the global transparency colour you can temporarily change it to another colour (not used in your tiles) using the PALETTE OVER command before using TILE. Alternatively, you can use the LAYER ERASE command (see the Quick erase and fill section above) to clear regions of the screen to the global transparency colour before drawing tiles on top.
Layer 2 and LoRes tilemaps are stored separately, so you can use both simultaneously. The TILE commands affect the currently selected layer/mode. These are:
TILE BANK n
which defines bank n as containing the tiles (up to 4 banks n...n+3 if 16x16 tiles).
TILE DIM n,offset,w,tilesize
defines bank n as containing the tilemap, starting at offset offset in the bank. The tilemap is width w (1–2048) and uses 8x8 (tilesize=8) or 16x16 (tilesize=16) tiles.
TILE
TILE AT x,y
Draws an entire screen from tilemap, from tile offset x,y in the tilemap (0,0 if not specified).
TILE w,h
TILE w,h AT x,y
2 You may remember that we spoke of tiles before, when initially discussing Layer 3 in Chapter 14. The principle is the same (a repeated rectangular pattern) but the specifics change (9-bit colour vs. 4-bit or 1-bit colour and 16x16 -or- 8x8 pixel tiles vs. ONLY 8x8 pixel tiles).
TILE w,h TO x2,y2
TILE w,h AT x,y TO x2,y2
The above draw a section of screen from a tilemap. Number of tiles to draw is width w, height h. The AT draws from tile offset x,y in the tilemap (or 0,0 if not specified as in the previous example), and the TO draws to the tile offset x2,y2 on the screen (or 0,0 if not specified).
Accessing non-supported graphics modes
We spoke previously about how NextBASIC does not support the higher resolutions provided by Layer 2 and the Next hardware. That's not entirely accurate however as there are ways through the power of Next Registers (See Chapter 22) and BANK POKE (See Chapter 23) to do it regardless. There are a few unknown commands in the following short program which you will soon encounter, however the point of the exercise is to show what is possible. For now type it and run it and we'll revisit it in Chapter 23:
 10 RUN AT 3
 20 REG 112, @10000:REM L2
    SELECT 320x200
 30 REG 24,0:REG 24,159: REG
    24, 0: REG 24,255: REM
    setup clipping window
 40 REG 105,128:REM SHOW L2
 50 FOR %f=0 to 16383
 60 BANK 9 POKE %f, %RND(255)
 70 BANK 10 POKE %f, 30
 80 BANK 11 POKE %f, %RND
    (230)
 90 BANK 12 POKE %f, 60
100 BANK 13 POKE %f, %RND
    (128)
110 NEXT %f
120 PAUSE 0
Exercises
-
Play about with PAPER, INK, FLASH and BRIGHT items in a PLOT statement. These are the parts that affect the whole of the character position containing the pixel. Normally it is as though the PLOT tatement had started off:
PLOT PAPER 8; FLASH 8; BRIGHT 8;and only the ink colour of a character position is altered when something is plotted there, but you can change this if you want. Be especially careful when using colours with INVERSE 1, because this sets the pixel to show the paper colour, but changes the ink colour and this might not be what you expect.
-
Try:
CIRCLE 100,87,80: DRAW 50,50You can see from this that the CIRCLE statement leaves the PLOT position at a rather indeterminate place – it is always somewhere about halfway up the right hand side of the circle. You will usually need to follow the CIRCLE statement with a PLOT statement before you do any more drawing.
ZX Spectrum Next User Manual, 3rd Edition (ISBN 978-1-5272-5496-1), written and illustrated by Phoebus R. Dokos. Copyright © 2020-2024 Phoebus Dokos / SpecNext Ltd. Licensed under CC BY-NC-SA 4.0. This is a transcription and can contain errors; check any doubt against the printed page.